Quick start
Let’s now go through the neccessary steps for doing a DIC analysis on a set of images. First, we need to import the tools:
import muDIC as dic
Assuming that you have all the pictures you need in a folder, we can import them all into an image stack:
path = r"/the/path/to/the/images/"
image_stack = dic.image_stack_from_folder(path,file_type=".tif")
We are now ready to generate a mesh, and to do that, you first need to instantiate a mesher object:
mesher = dic.Mesher()
Mesher can take a set of settings such as polynomial order and pre-defined knot vectors. If none are given, it uses the default first order polynomials.
Now, let us make a mesh on the first image in the image_stack object we have made earlier:
mesh = mesher.mesh(image_stack)
A GUI will now pop up, looking something like this:
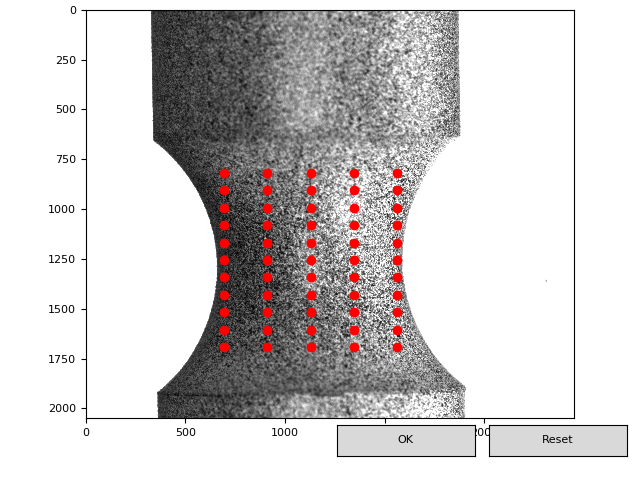
You can now drag a rectangle over the region you want to cover by the mesh. To manipulate the mesh, you can use:
- A,D: add or remove element in the horizontal direction
- W,X: add or remove element in the vertical direction
- arrow keys: move the mesh one pixel in the direction of the arrow
A good initial guess on element size is in the order of 40x40 pixels in each direction.
In order for us to run a DIC analysis, we have to prepare the inputs by generating a settings object:
inputs = dic.DICInput(mesh,image_stack)
We are now ready for running a DIC-analysis. We now make a DIC-job object, and call the .run() method:
dic_job = dic.DICAnalysis(inputs)
results = dic_job.run()
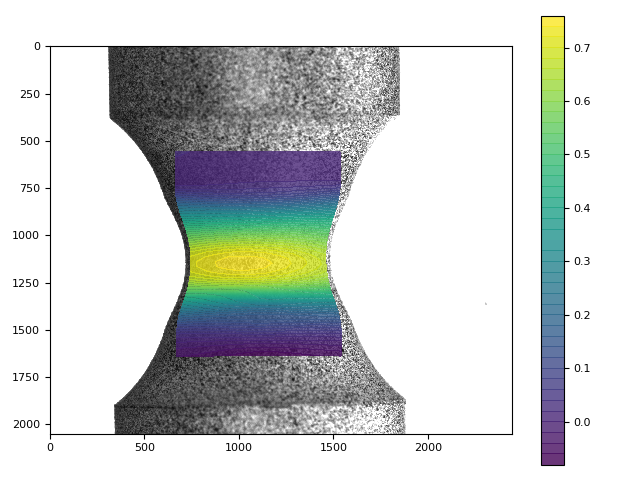
We can now calculate the fields such as deformation gradients and strains:
fields = dic.Fields(results)
If you want to extract a field for use somewhere else, you can do this by calling the method with the same name as the field variable you want:
true_strain = fields.true_strain()
If you want to visualise the results, correlate_img_to_refthere are tools made for this purpose. First, we need to instanciate it:
viz = dic.Visualizer(fields,images=image_stack)
If we provide the images argument, the fields will be overlayed on the images. Then, we can use the .show method to look at a field for a given frame:
viz.show(field="True strain", component = (1,1), frame = 39)
which will show the figure below: